
Uses of Computer Chart: In today’s digital age, the power of computer charts for data analysis and decision-making cannot be overstated. These visual representations of data provide a clear and concise way to interpret complex information, enabling businesses and individuals to make informed choices and drive success.
Whether you are a business owner, a healthcare professional, an educator, a researcher, or a finance expert, understanding the practical uses of computer charts is essential. In this article, we will demystify the power of computer charts and explore five practical uses that you need to know.
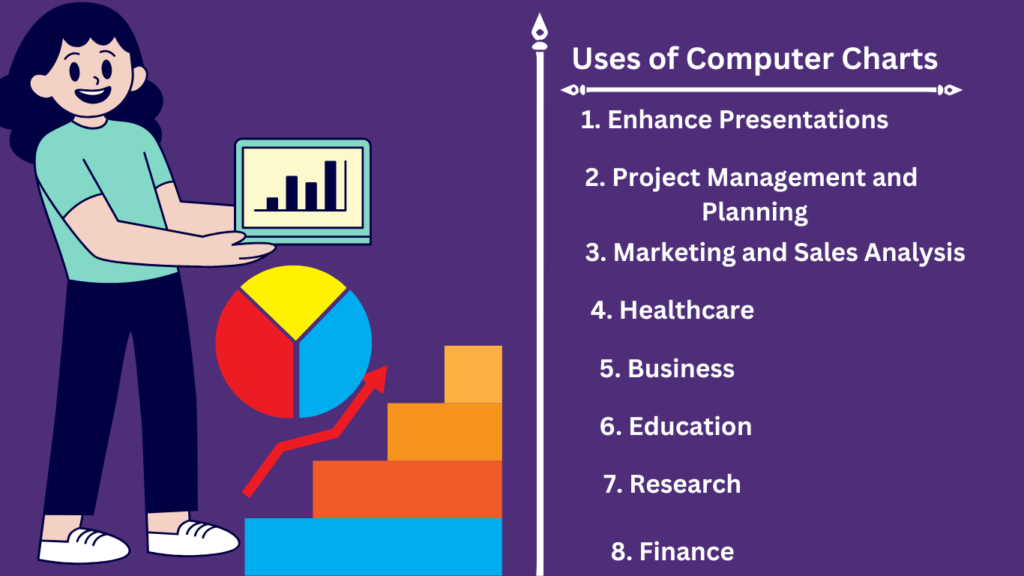
Uses of Computer Charts in Different Fields
1. Enhance Presentations
.Computer charts offer a dynamic and visually appealing way to convey information to an audience. Whether you are presenting sales figures, market trends, or project updates, using computer charts can significantly enhance your presentation. Instead of overwhelming your audience with rows of numbers and text-heavy slides, you can present your data in a visually engaging manner.
Bar graphs, line graphs, and pie charts can effectively communicate patterns, comparisons, and proportions. By incorporating computer charts into your presentations, you can capture and retain your audience’s attention while ensuring that your message is clearly understood.
2. Project Management and Planning
This is where computer charts come into play. In the world of project management, staying organized and keeping track of progress is crucial. Gantt charts, for example, are widely used to plan and schedule projects. With a Gantt chart, you can visualize the timeline of tasks, dependencies, and milestones.

Computer Chart allows project managers to identify potential bottlenecks, allocate resources efficiently, and monitor progress effectively. By using computer charts for project management, you can streamline workflows, improve collaboration, and ensure that projects are completed on time and within budget.
3. Marketing and Sales Analysis
Computer charts provide marketers and sales professionals with valuable insights into customer behavior, market trends, and campaign performance. By analyzing data through charts, you can identify target audiences, track customer preferences, and measure the effectiveness of marketing campaigns.
For instance, line charts can reveal sales trends over time, while pie charts can showcase the market share of different products or services. By harnessing the power of computer charts, you can make informed marketing and sales decisions that drive growth and maximize revenue.
4. Healthcare
Computer charts have revolutionized the healthcare industry by streamlining processes, improving patient care, and facilitating research. Electronic health records (EHRs) have replaced traditional paper charts, enabling healthcare professionals to access patient information quickly and accurately.

Computer charts also play a crucial role in public health by tracking disease outbreaks, analyzing epidemiological data, and informing policy decisions. By leveraging computer charts in healthcare, professionals can enhance patient outcomes, improve efficiency, and advance medical research.
5. Business
Computer charts provide businesses with valuable insights that drive growth, improve operational efficiency, and increase profitability. For example, businesses can use scatter plots to identify correlations between variables, such as advertising spend and sales revenue. By visualizing this relationship, businesses can make data-driven decisions to optimize marketing strategies and increase return on investment.
Moreover, computer charts can help businesses track key performance indicators (KPIs), such as customer satisfaction, employee productivity, and financial metrics. By monitoring these metrics through charts, businesses can identify areas for improvement and implement targeted strategies to achieve their goals.
6. Education
Education is another domain where computer charts can significantly enhance learning outcomes. Teachers can use charts to illustrate complex concepts, present data in a digestible format, and engage students in the learning process. For instance, line graphs can show historical trends, bar graphs can compare data sets, and pie charts can represent proportions.
By incorporating computer charts into lesson plans, educators can cater to diverse learning styles and promote data literacy. This hands-on approach develops critical thinking and analytical skills and fosters creativity and collaboration.
7. Research
Research across various disciplines relies heavily on data analysis and visualization. Computer charts provide researchers with a powerful tool to explore data, identify patterns, and communicate findings effectively. In scientific research, charts such as scatter plots, histograms, and box plots are commonly used to analyze experimental results, visualize distributions, and compare data sets.
In social sciences, charts like line graphs and bar charts help researchers present survey data, track trends, and draw insights from large datasets. By utilizing computer charts in research, scholars can streamline the analysis process, facilitate peer communication, and contribute to the advancement of knowledge.
8. Finance
In the finance industry, computer charts are instrumental in analyzing market trends, managing portfolios, and making investment decisions. Stock charts, for example, display the historical price movements of stocks, allowing traders and investors to identify patterns, trends, and support/resistance levels.
These charts help financial professionals make informed decisions regarding buying, selling, or holding stocks. Moreover, financial institutions use computer charts to track performance indicators, such as return on investment, risk-adjusted returns, and portfolio diversification. By visualizing financial data through charts, finance professionals can monitor market conditions, assess risk, and optimize investment strategies.
Conclusion: Uses of Computer Charts in Various Fields
Computer charts are a powerful tool that can be utilized across various industries and disciplines. Whether you are presenting data, managing projects, analyzing market trends, or conducting research, computer charts enhance decision-making and facilitate effective communication.
By understanding and harnessing the practical uses of computer charts, you can unlock valuable insights, drive success, and stay ahead in today’s data-driven world.